

search
attachments
weblink
advanced
Overview
Content Tools
Activity
Activity for August 2020
Period:
month
| week
| day
Month:
<< Previous |
Now |
Next >>
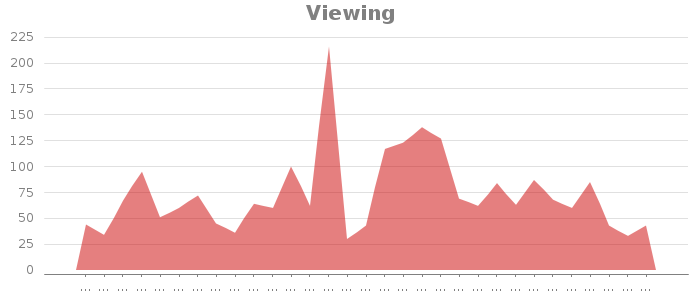
This graph shows how many times pages and blog posts have been viewed over the current time period.
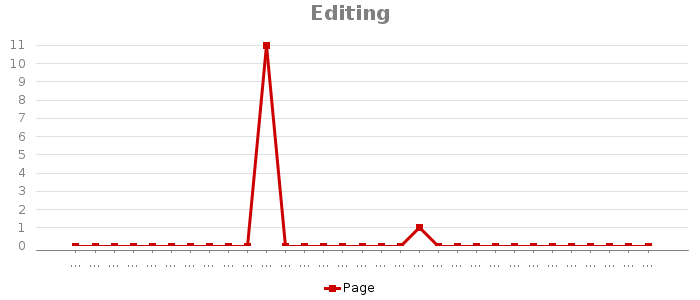
This graph shows how many pages, blog posts and comments have been created or updated over the current time period.
| Most popular content (Views) | Most active content (Edits) | Most active contributors (Edits) |
|---|---|---|
|
|